Overview
Read a database service's health and topology, find connection details, and use node actions and status banners.
Open a database service and select Overview. The health card at the top summarizes the service. The Topology card below it shows the servers and their connections. Notices above the cards identify work in progress or a problem that needs attention.
Check the service health
Start with Database service health, the upper card. The large message names any components that need attention. Hover over it for more detail. The health badge at the right of the card heading shows the overall state. For a warning or error, hover over the badge to see when it started.
Health describes the checks of the running components. The service’s lifecycle status, such as Deploying or Running, describes the result of console operations. A Running service can still have a health problem. See Service health and Lifecycle.
Select Run health check on the right to check again. Before the service is deployed, there are no live components to check. In some states, this button is replaced by View logs, which opens the operation history.
The fields below the health message show:
| Field | Meaning or next action |
|---|---|
| Uptime | Time since the primary’s PostgreSQL process started, not time since the service was created. |
| Last health check | How recently the console checked the service. Hover for the timestamp. |
| License | The license tier, size and server usage. Select it to open the License page. |
| PostgreSQL and TimescaleDB | Versions read from the service. |
| Database size | The database size reported by PostgreSQL. Use the topology’s disk readings to check filesystem capacity. |
| Backups | A summary of backup protection. Select it to open the Backups tab. |
| Last operation | The latest run and when it ran. Hover for its status and timestamp; open the Operations tab for its log. |
| Monitoring | Select View metrics for the service’s charts. |
A dash means the console has no value to show. If a health check could not read a field, hover over the dash for the reason.
Under License, capped means TimescaleDB runs within the license’s CPU and memory limits. limits not applied means the limits on a server do not match the current license or server size. See Servers bigger than the license before applying limits or restarting.
Read the topology
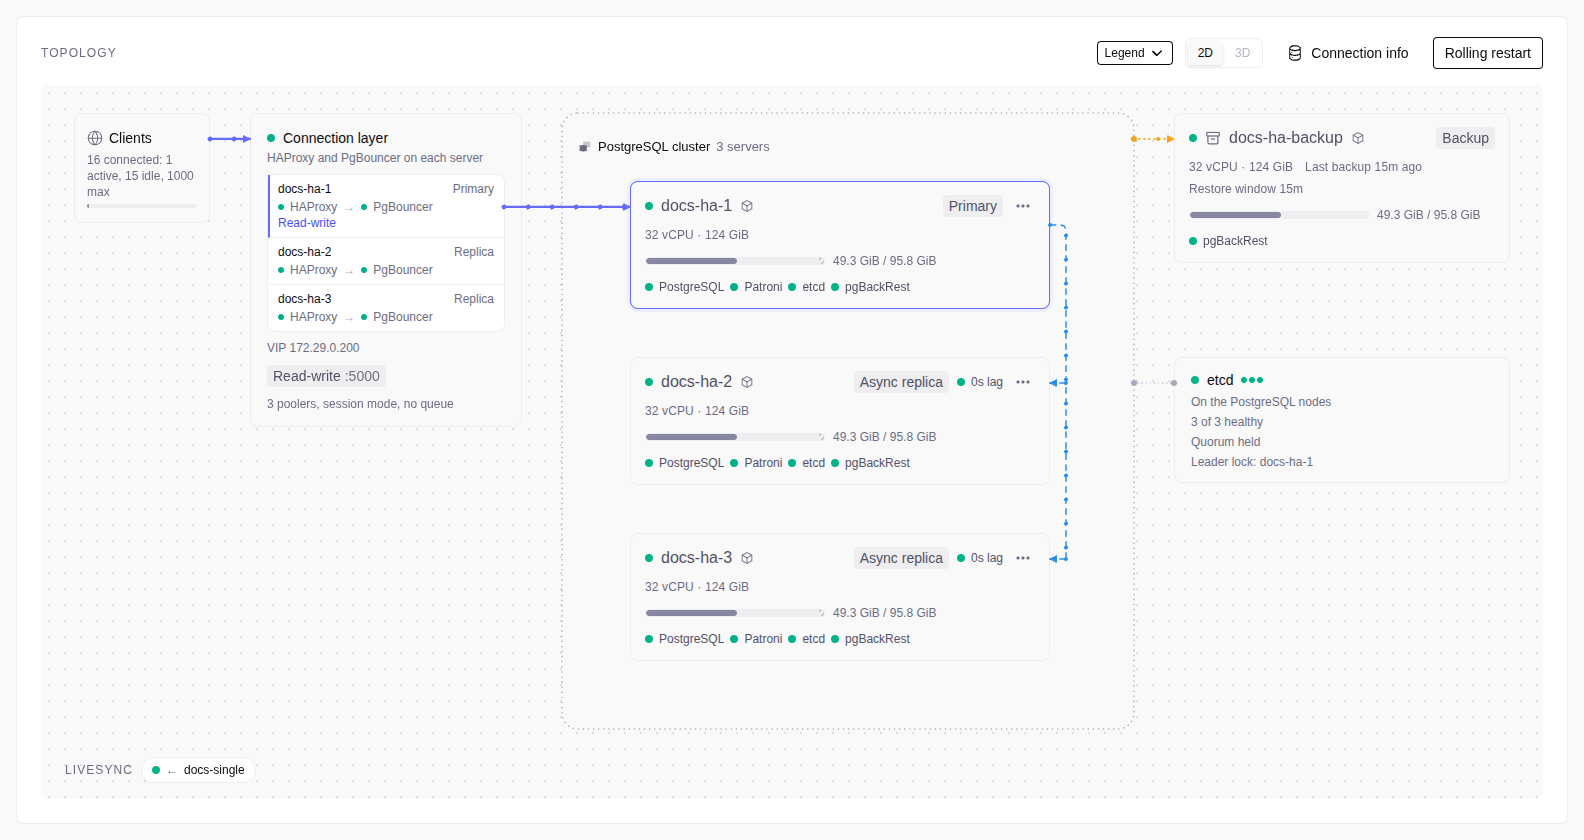
The lower card maps the service’s connection path, PostgreSQL nodes and supporting services. An HA service shows its primary and replicas, with replication state and lag. Backup and DCS servers appear when the service uses them. A Standard service has a smaller map.
Read each server card for its role, PostgreSQL state, component health and disk use. The diagram distinguishes client traffic from replication and backup connections. Use Legend in the Topology header to read the symbols and colors.
The 2D and 3D controls in that header switch the view. The browser remembers your choice. The view stays in 2D on a narrow screen, when your system requests reduced motion, or when the browser has no WebGL support.
Find connection details
Select Connection info at the right of the Topology header. The dialog has connection strings and other endpoints. Viewers and operators do not see the database password. See Connect for endpoint selection and client examples.
Act on a node
Open the three-dot menu beside a node’s role. Actions depend on the node, your role and the service state:
- Switchover and Failover appear on replicas. Switchover moves the primary role with a brief pause in writes. Failover is for a primary that is down and can lose data. See Failover and switchover.
- Restart restarts PostgreSQL on that node and disconnects its clients. On a multi-node service, Rolling restart in the Topology header restarts the nodes one at a time. The primary restarts in place, so its connections also drop briefly. These actions need the operator role or higher.
- Free emergency space and Recreate emergency reserve manage the reserve files. Follow Balloon files before using them: freeing space puts the service into read-only mode.
- Replace server and Fill with a server on an empty slot are for replacing a machine. Follow Replace a server. These actions need the admin role.
- View diagnostics opens the service’s Logs & Diagnostics tab.
If no remote backup server is attached, the topology shows a placeholder. An admin can select an enrolled backup server there or select Register a server. Manage the backup copies and apply their configuration on the Backups tab.
When this service is a source or target of LiveSync, its sessions also appear with the topology. See LiveSync.
Follow a notice
Notices appear above the health card. Read the notice before using its button; a restart, redeploy or recovery action can interrupt clients.


| Notice | What to do |
|---|---|
| Not deployed, or last deployment failed | Deploy the service, or use View operation to read the failed run before trying again. See Operations. |
| Operation in progress | Follow its log. Wait for the operation to finish before starting another change. |
| Updates available, versions differ, or redeploy recommended | Read the notice to distinguish a version upgrade from reapplying configuration. More than one reason shows as one notice, Deploy the service again. See Upgrade a service. |
| Restart pending, or extensions are not created | Read which extensions or settings are waiting and the stated restart impact. On a Standard service, a deploy does not restart PostgreSQL. See Extensions, Settings and Deploy. |
| Restart to apply the license | Review Changing the license of a deployed service. |
| Read-only or emergency space notice | Follow Balloon files. Freeing reserve space does not itself restore writes. |
| DCS quorum, LAN address, stranded VIP, or console clock warning | Resolve the named infrastructure problem. Start with Operational runbooks, Change IP addresses, or Time sync. |
The actions offered depend on your role. A viewer can inspect health and topology; maintenance actions need an operator or admin. See Roles.