Metrics
Metrics of each server and database service on the Monitoring tab, metrics retention, PromQL queries, and federation into your own Prometheus.
The console collects metrics from each database server and keeps them for 30 days by default. For alerts, see Alerts.
The Monitoring tab
The Monitoring tab of a service has seven panels:
| Panel | Shows |
|---|---|
| CPU | CPU use (%) |
| Memory | Memory use (%). Hover to see the bytes. |
| Storage | Database size and disk used |
| Transactions per second | Commits plus rollbacks |
| Disk IOPS | Read and write operations per second |
| Disk bandwidth | Read and write bytes per second |
| Connections | Total and active. Hover to see max_connections. |
Each panel has one chart for each PostgreSQL server, primaries first. A service with a replica has a node filter: All nodes, Primary, or one server.
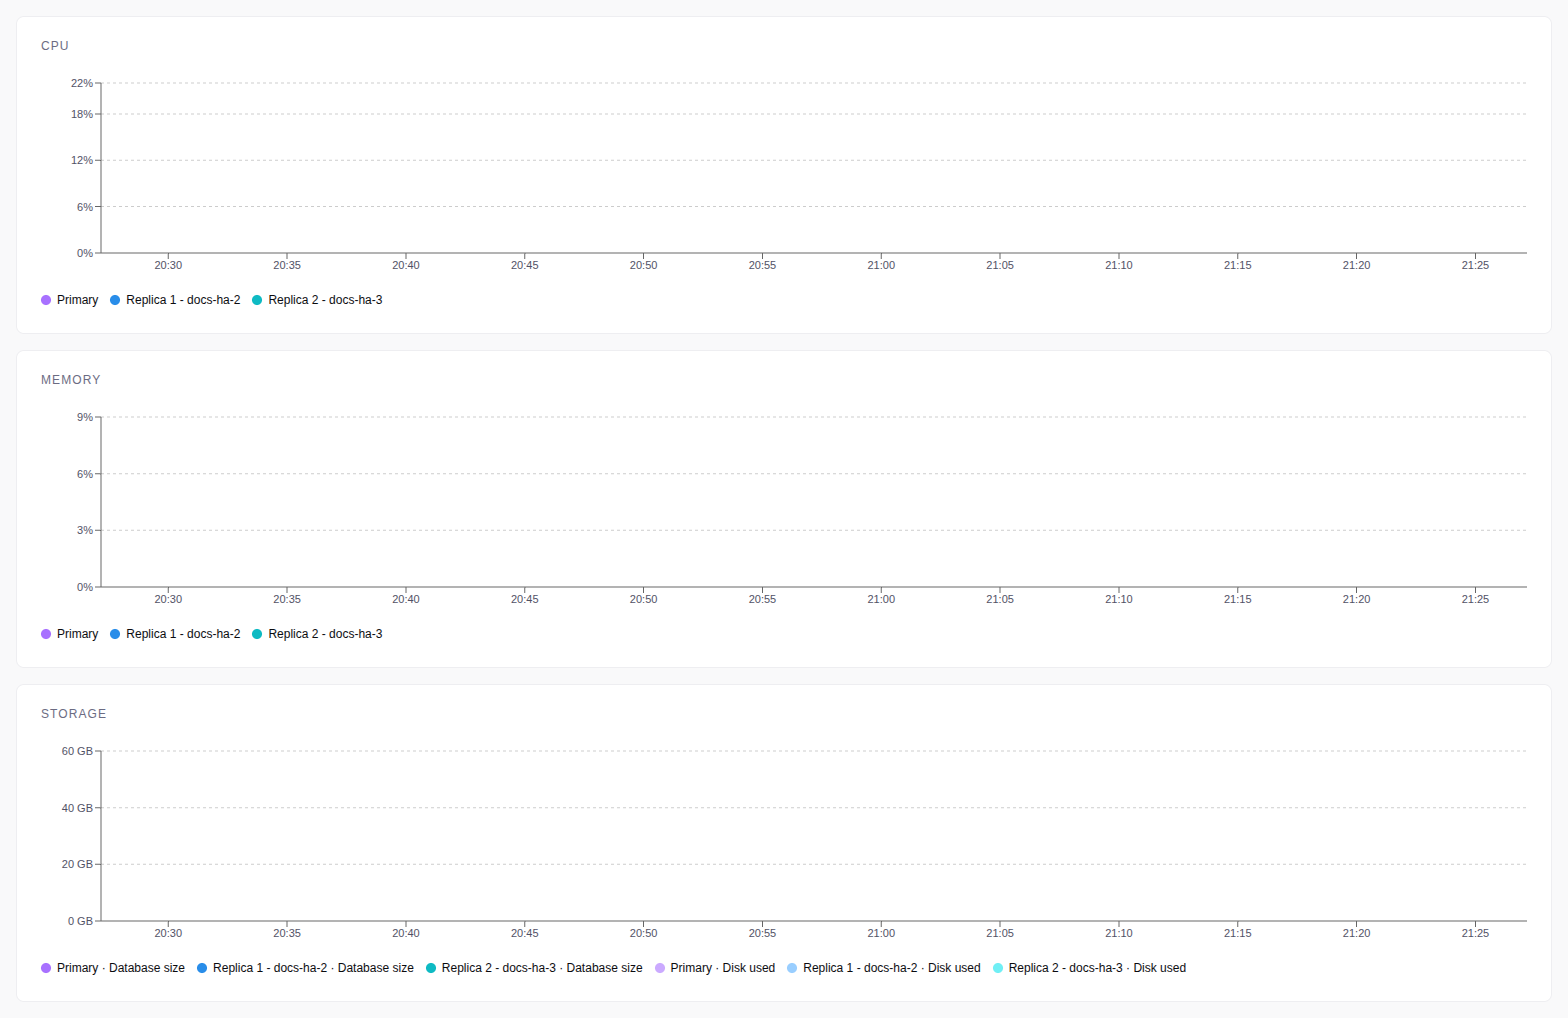
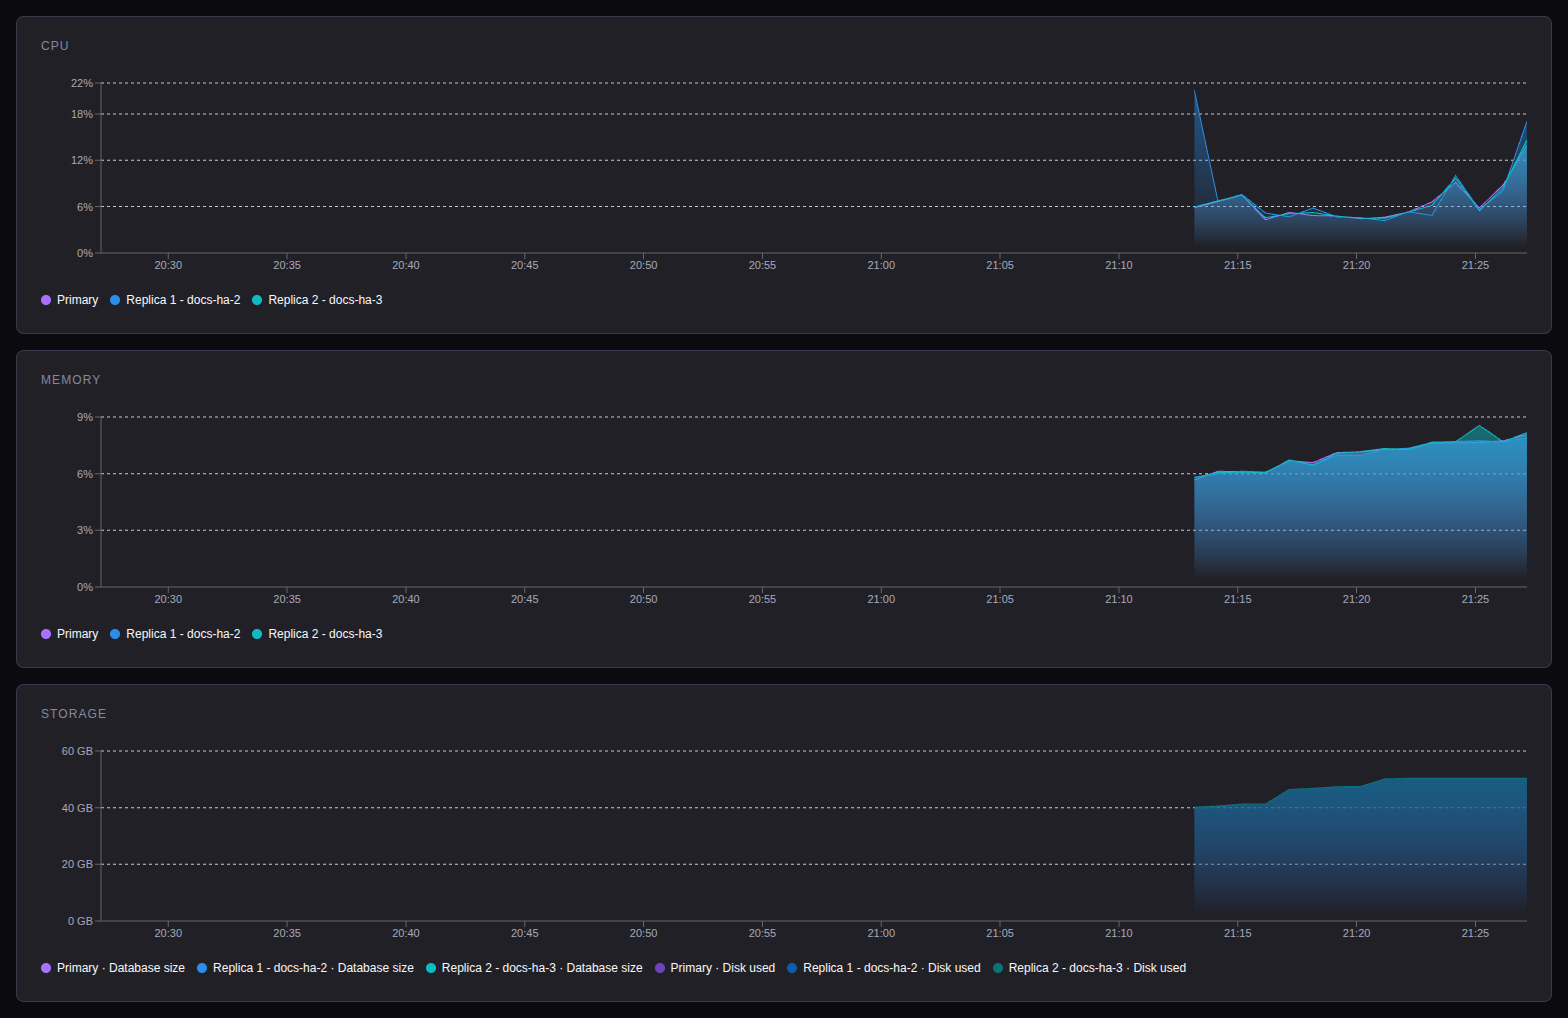
- The time range goes up to Last 30 days.
- Red shading marks a critical alert of the service, amber a warning. Hover to see the alerts.
- CPU and Memory show percent of the full server. When the license limits TimescaleDB, a dashed License limit line shows the limit (for example 25% for a 4 vCPU license on a 16 vCPU server).
Monitoring settings
Open Administration → Monitoring (admin only).
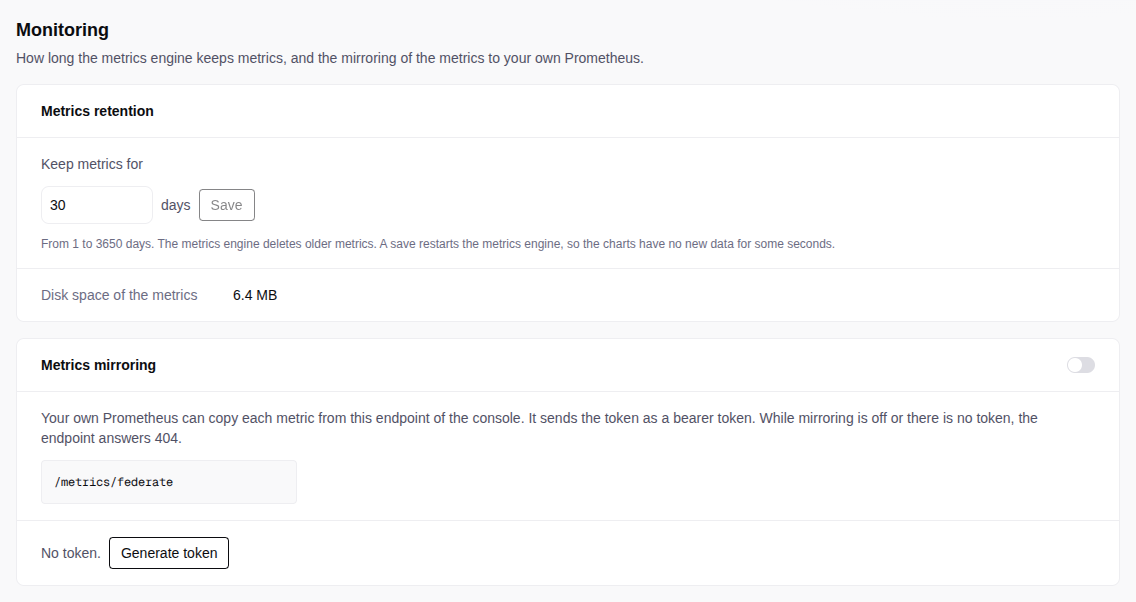
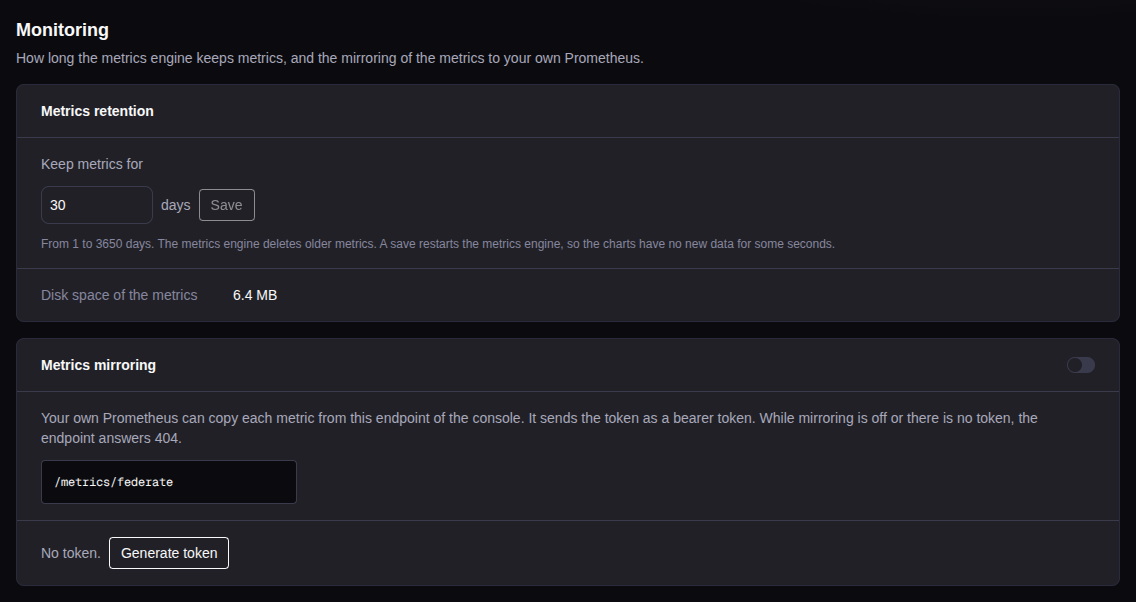
- Keep metrics for: 1 to 3650 days (default 30). The page shows the disk space that the metrics use. A shorter time deletes the older metrics. After a save, the charts get no data for some seconds.
- Metrics mirroring: lets your own Prometheus copy the metrics. See Federate into your own Prometheus.
PromQL queries
To query the metrics with PromQL, use POST /api/v1/promql/query or
POST /api/v1/promql/query_range (viewer role). They return Prometheus JSON.
See the API reference.
Federate into your own Prometheus
Make a token
In Administration → Monitoring, turn on Metrics mirroring and select Generate token. Copy the token. The console shows it only once.
Scrape the console
Add this job to your Prometheus:
scrape_configs:
  - job_name: timescale-enterprise
    honor_labels: true
    metrics_path: /metrics/federate
    params:
      "match[]": ['{__name__=~".+"}']
    authorization:
      credentials: <token>
    static_configs:
      - targets: ["<console-host>"]
/metrics/federate returns 404 while mirroring is off or there is no token.
Rotate token makes a new token. The old token stops at once.
The export also has these metrics of the console:
| Metric | Value |
|---|---|
tse_console_up |
Always 1. No series: the console does not answer. |
tse_backup_needs_attention{service} |
1 when the backups of the service need attention |
tse_server_enrolled{server} |
1 when enrollment is complete, 0 while pending |
tse_license_expiry_timestamp_seconds{licence_id, licence} |
Expiry time of each installed license with an end date |
tse_license_expired{licence_id, licence} |
1 for an expired license that a service uses, or when no active license is installed |
tse_console_clock_offset_seconds{source} |
Seconds to add to the console clock (source is ntp or servers). See Console clock. |
tse_console_clock_offset_known |
1 when the console knows its clock offset |
tse_health_read_duration_seconds |
Histogram of the time of one service health read |
tse_health_reads_due |
Services with a due health read that did not start |
tse_health_oldest_check_age_seconds |
Age of the oldest last health check of a running service |
tse_console_backup_last_success_timestamp_seconds{target,schedule} |
Time of the newest console backup. Manual backups have no schedule. |
tse_console_backup_last_run_failed{target,schedule} |
1 when the last console backup failed |
tse_console_backup_last_run_duration_seconds{target,schedule} |
Duration of the last console backup |
tse_console_backup_archives{target} |
Console backups on the target, also those of other consoles. Listed every 10 minutes. |
tse_console_backup_archive_bytes{target} |
Size of the console backups on the target |
tse_console_backup_key_confirmed |
1 when an admin confirmed the recovery key. Without it, no console backup runs. |
tse_console_backup_schedules_enabled |
Console backup schedules that are on |
tse_console_backup_schedule_stale_after_seconds{target,schedule,cron} |
Backup age at which ConsoleBackupStale fires |
Starter dashboards for your own Grafana: postgres-exporter, node-exporter, patroni, haproxy, pgbouncer-exporter, and timescaledb.