Alerts
Built-in alert rules, notifications by Slack, Teams, webhook or email, a heartbeat for the console, and alert settings for each database service.
The console checks a fixed set of alert rules. It sends no notification until you add a destination.
Open Alerts in the top bar. The page has four tabs:
| Tab | Use | Who can change it |
|---|---|---|
| Status | The current state of each rule | Admin (the planned operations setting) |
| Rules | The global settings of each rule | Admin |
| Destinations | The destinations, the heartbeat, and the email server | Admin |
| Services | The alert settings of each database service | Operator. The routing needs an admin. |
Configure delivery first
Add a destination
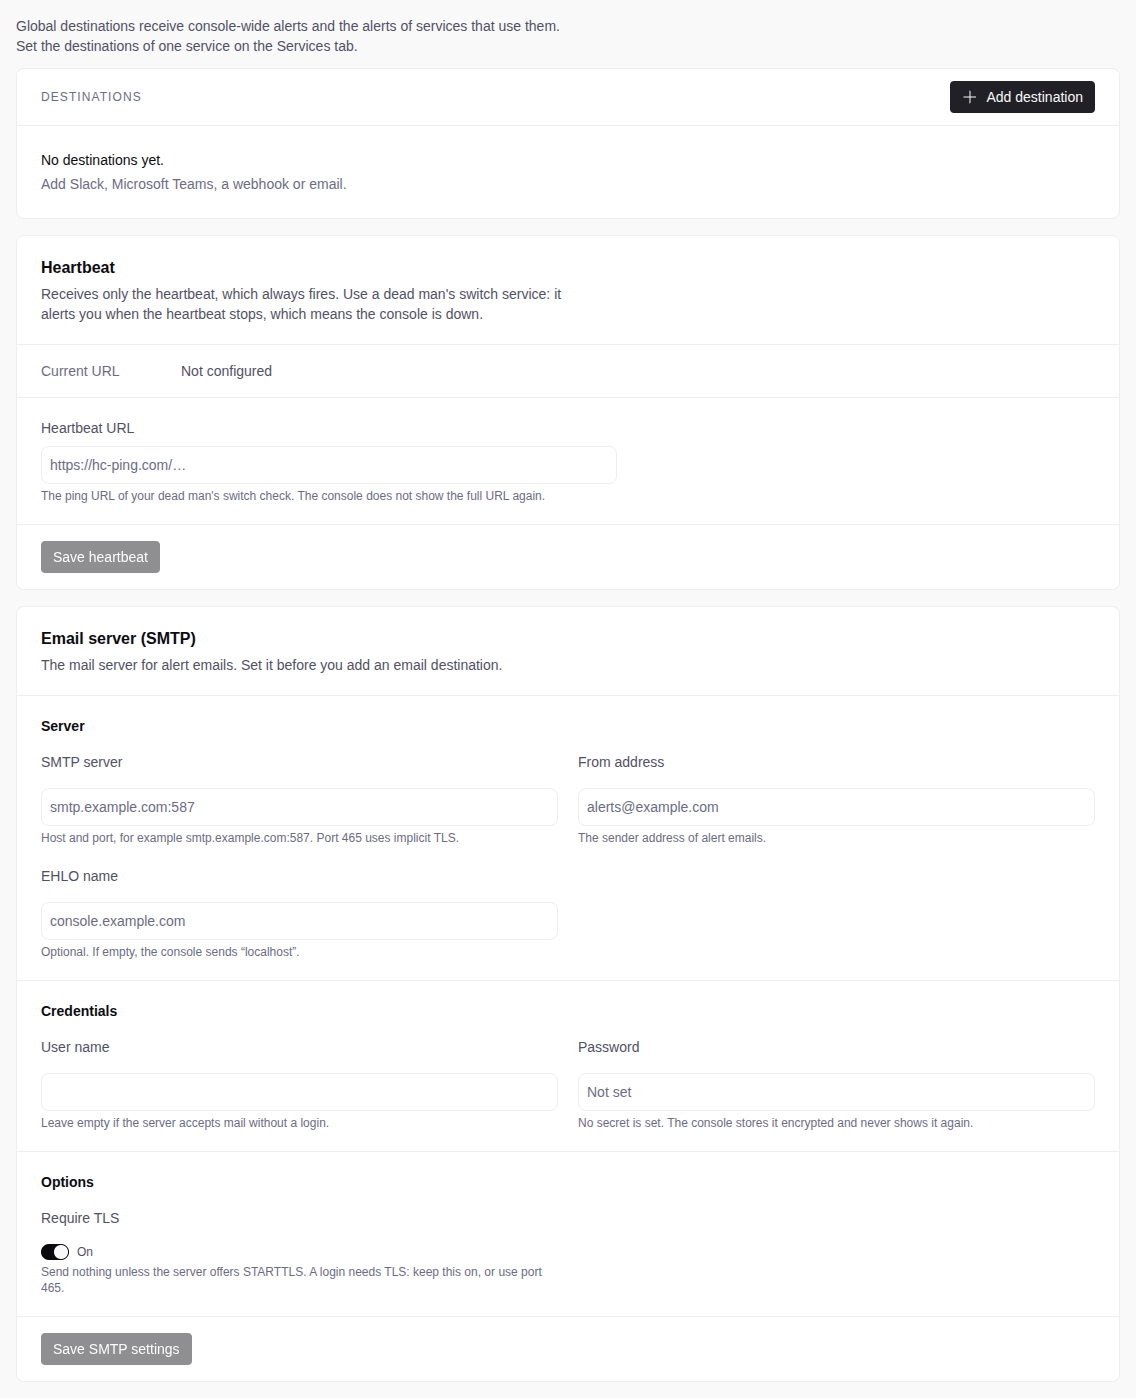
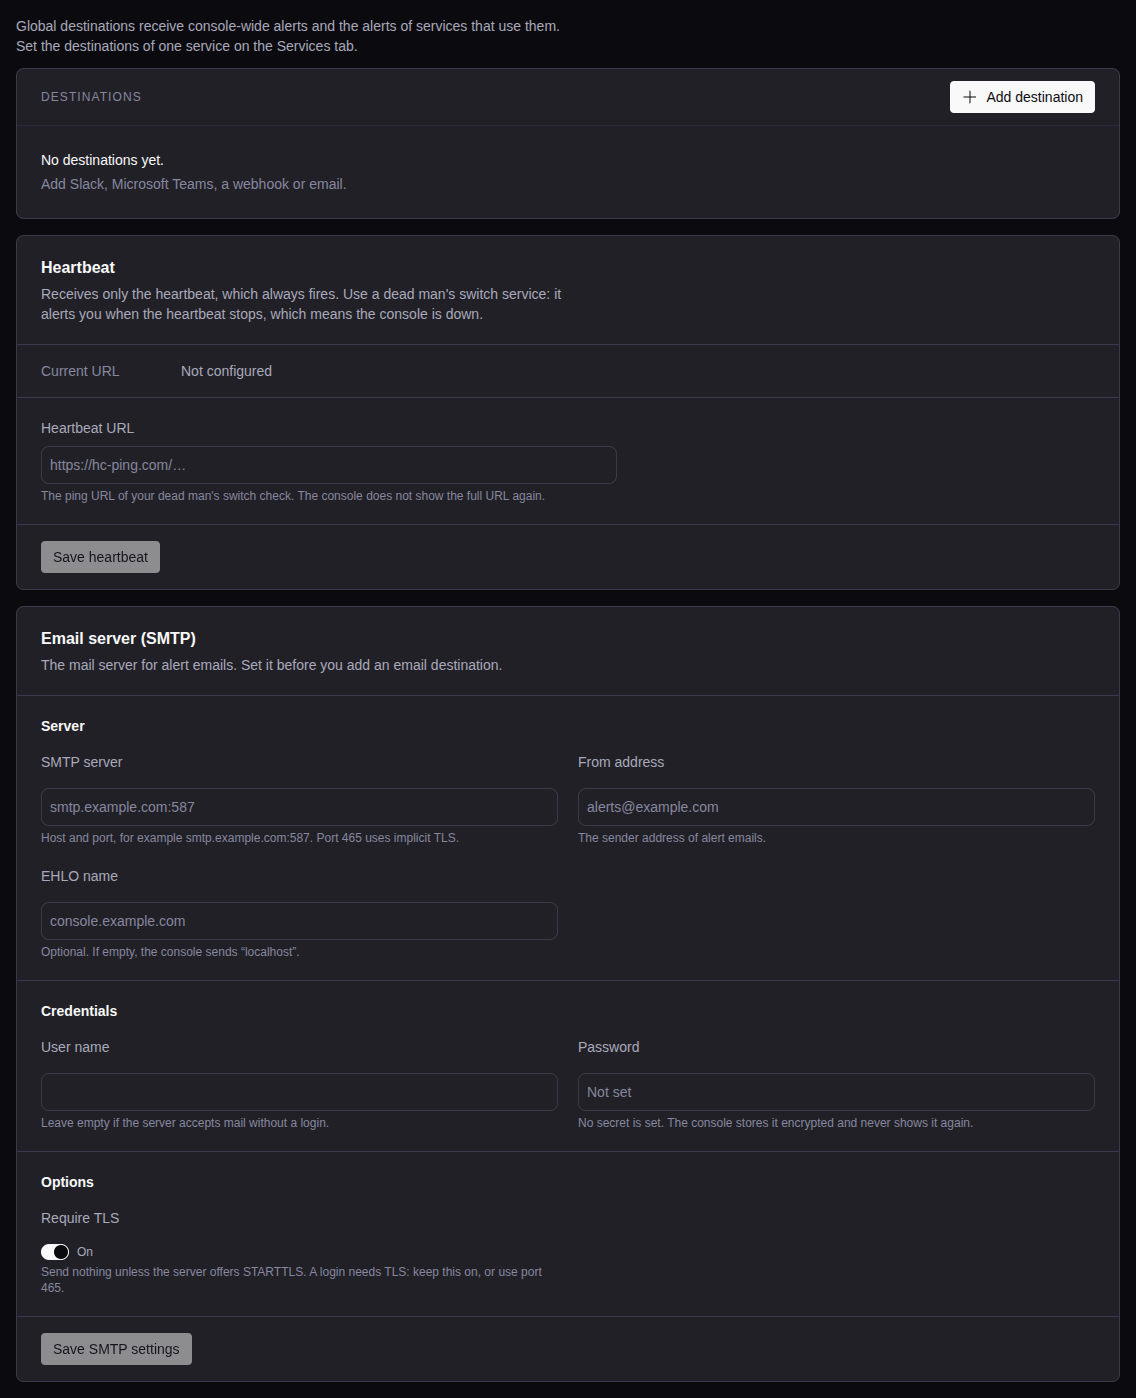
On the Destinations tab, select Add destination.
Fill in the panel
- Type: see the table below.
- Name: up to 64 characters.
- The URL or the recipients.
- Send: All alerts, or Critical only.
- Global destination: on by default.
Select Add destination.
Test the destination
In the menu of the destination, select Test.
| Type | Field |
|---|---|
| Slack | Incoming webhook URL of a Slack app |
| Microsoft Teams | Workflow URL of a Teams workflow “Post to a channel when a webhook request is received” |
| Webhook | Webhook URL of an endpoint that accepts Alertmanager webhook JSON, for example PagerDuty or Opsgenie |
| Recipients, separated by commas. Set up the email server first. |
For Slack and Teams, use their type, not Webhook.
A global destination receives the Console rules and the alerts of each service that uses the global destinations. Turn Global destination off for a destination that only some services use.
- With no global destination, the page shows No global destination. These alerts go nowhere.
- When a global destination cannot deliver, the page shows The global destinations cannot deliver.
Edit changes the Name, Send and Global destination. To change the URL or the recipients, remove the destination and add it again.
If TSE_DB_ENCRYPTION_KEY changes, the destinations and the heartbeat URL
show cannot be decrypted, and no notification goes out. Remove and add
each destination again, set the heartbeat URL again, and enter the SMTP password
again.
On the Destinations tab, fill in Email server (SMTP), then select Save SMTP settings. Do this before you add an Email destination.
| Setting | Value |
|---|---|
| SMTP server | host:port, for example smtp.example.com:587. Not a loopback, unspecified or link-local address. |
| From address | The sender. Many servers accept only an address of their own domain. |
| User name and Password | Optional. Leave User name empty for a relay with no login. |
| EHLO name | Optional. Empty sends localhost. |
| Require TLS | On by default. The console uses STARTTLS and sends nothing to a server without it. |
- Port 465 always uses implicit TLS.
- The server certificate must be valid for the host name that you entered.
- A login needs TLS: the console refuses a User name when Require TLS is off and the port is not 465.
- To remove the SMTP settings, remove the email destinations first.
A failed Test gives the step and the SMTP reply code, for example code 535 at the login step.
The heartbeat
The rule Watchdog always fires. Its notification is the heartbeat: when the
console stops, the heartbeat stops.
Make a check
In a dead man’s switch service (for example Healthchecks.io or Dead Man’s Snitch), make a check that alerts when the pings stop.
Set the URL
On the Destinations tab, under Heartbeat, enter the Heartbeat URL and select Save heartbeat.
The console sends the heartbeat every minute, as a webhook, only to that URL. It sends no resolved notification.
Alert rules
All rules except Watchdog have a severity, Warning or Critical.
Infrastructure
| Rule | Fires when | Default severity |
|---|---|---|
ServiceDown |
A monitored exporter does not answer for 5 minutes | Critical |
DiskWarning |
A filesystem is at or above the warning percentage for 15 minutes | Warning |
DiskCritical |
A filesystem is at or above the critical percentage for 15 minutes | Critical |
DiskFillPredicted |
A filesystem will be full within the look-ahead time, for 30 minutes | Warning |
Database
| Rule | Fires when | Default severity |
|---|---|---|
PatroniNoLeader |
A cluster has no leader (no writes) for 5 minutes | Critical |
ReplicationLagHigh |
A replica is behind its primary by more than the threshold for 10 minutes | Warning |
ReplicaNotStreaming |
A replica does not stream from its primary for 10 minutes | Warning |
ArchiveCommandFailing |
WAL archiving fails for 15 minutes. WAL collects on the disk. | Critical |
BackupNeedsAttention |
The backups of a service need attention for 15 minutes, for example no backups, or corrupt pages | Critical |
Console
| Rule | Fires when | Default severity |
|---|---|---|
Watchdog |
Always. See The heartbeat. | None |
ServerNotEnrolled |
A server does not complete enrollment within 30 minutes | Warning |
LicenceExpiringSoon |
An installed license expires within the threshold. For a trial: 2 days, or the threshold if shorter. | Warning |
LicenceExpired |
A license that a service uses expired, or no active license is installed | Critical |
ConsoleClockWrong |
The console clock is wrong by more than 30 seconds for 10 minutes. See Console clock. | Warning |
ConsoleBackupFailed |
The last backup of a console backup schedule failed, for 15 minutes. It stays until a backup of that schedule succeeds. | Warning |
ConsoleBackupStale |
The newest backup of a schedule is older than its longest interval plus 2 hours (26 hours for the daily default), for 15 minutes | Critical |
Suppressed alerts
| When this fires | These do not notify |
|---|---|
DiskCritical |
DiskWarning and DiskFillPredicted on the same mount point |
ServiceDown for node_exporter |
DiskWarning and DiskFillPredicted |
ServiceDown for postgres_exporter |
ReplicationLagHigh |
Rule settings
On the Rules tab, each rule except Watchdog can be on or off, with a
severity. Five rules have a threshold:
| Rule | Field | Default | Range |
|---|---|---|---|
DiskWarning |
Warn when disk use reaches | 80% | 1 to 99 |
DiskCritical |
Alert when disk use reaches | 90% | 1 to 99, more than DiskWarning |
DiskFillPredicted |
Warn when a disk is projected to fill within | 4 hours | 1 to 168 |
ReplicationLagHigh |
Warn when replication lag exceeds | 300 seconds | 1 to 86400 |
LicenceExpiringSoon |
Warn when a licence expires within | 30 days | 1 to 365 |
Reset sets a threshold back to its default. Select Save changes. The change applies at once.
Notification timing
- The first notification of a group comes 30 seconds after the first alert.
- New alerts in a group come at most every 5 minutes.
- A group that continues to fire repeats every 4 hours.
- A group that stops firing sends a resolved notification.
Per-service settings
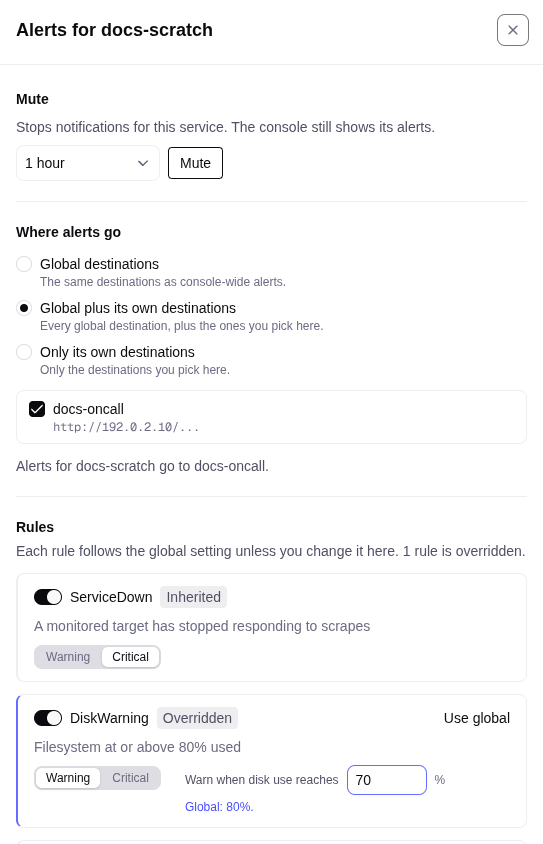
On the Services tab, select the service. Alert settings on the Monitoring tab of the service opens the same panel. A service follows the global settings except for the values that you change. Reset all to global removes the changes.
Routing
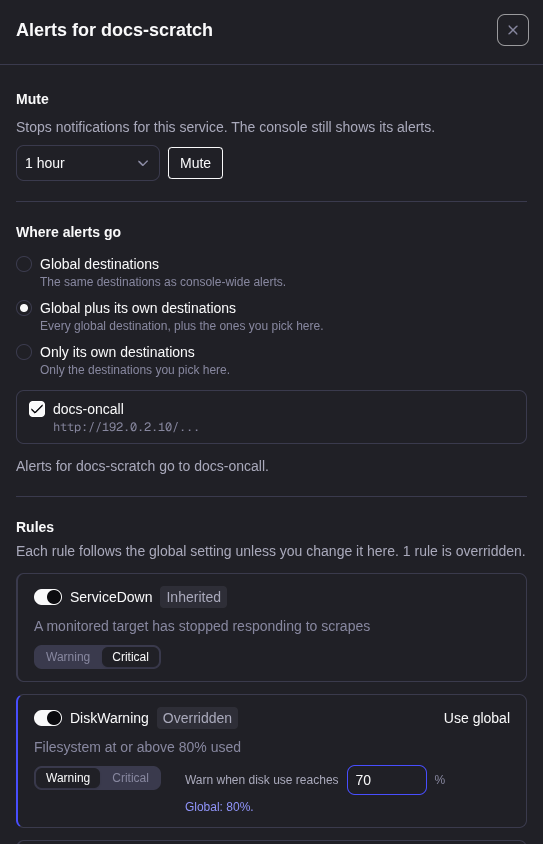
Where alerts go is Global destinations by default. A destination gets one notification, also when it is global and picked. You cannot remove the only destination of a service with Only its own destinations. Pick another destination or change the routing first.
Rule overrides
A service can override ServiceDown, the disk rules and the Database
rules. The Console rules are global only. The console refuses a
DiskCritical threshold at or below the DiskWarning threshold, and names
the service.
Mute
Mute stops all notifications of a service for 1 hour, 4 hours, 24 hours or 7 days. The Status tab still shows the alerts. A new mute replaces the old one. Unmute ends the mute.
The Status tab
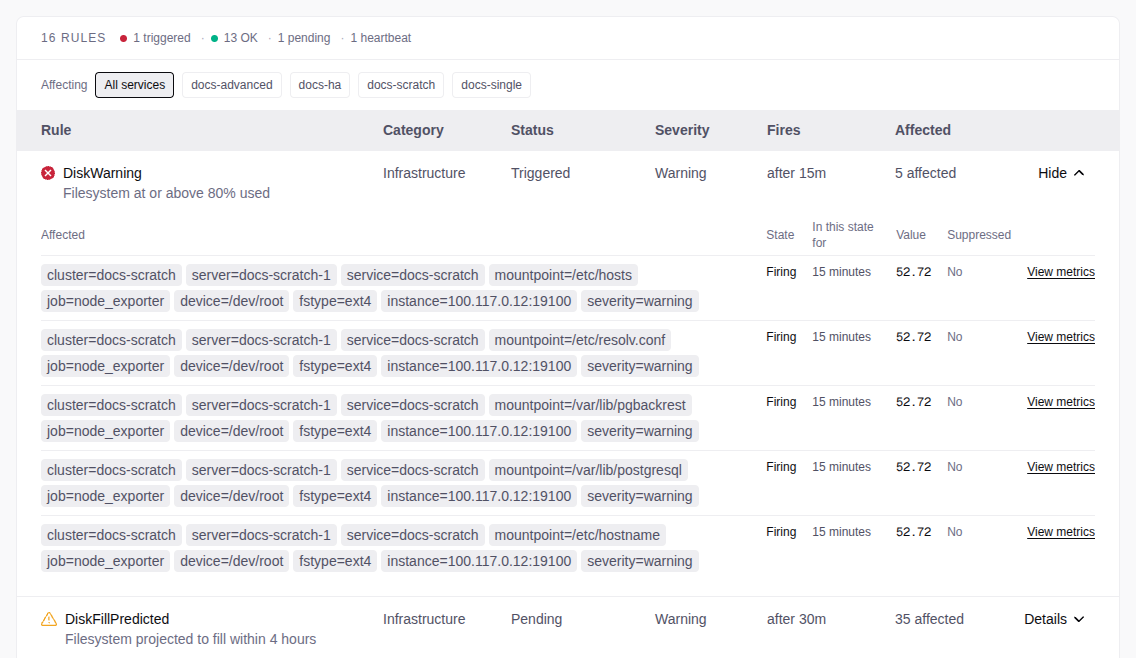
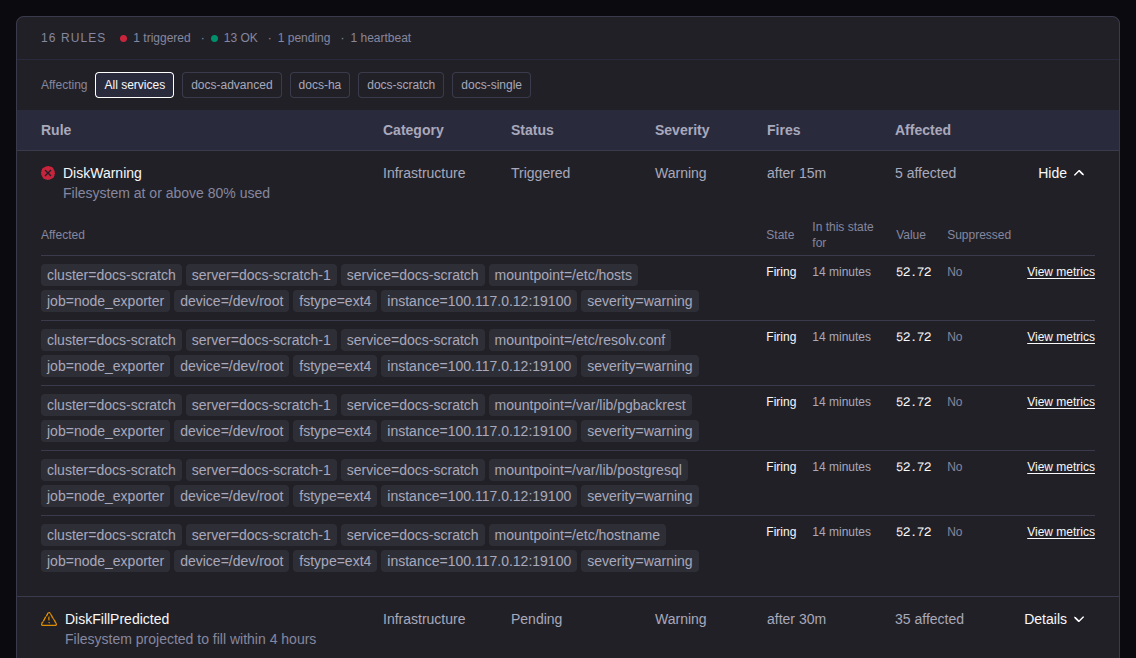
The Status tab has one row for each rule. Expand a row to see the servers, the time in that state, and the value.
| State | Meaning |
|---|---|
| Triggered | The alert fires now |
| Pending | The condition is true. The rule waits for its duration. |
| OK | The condition is false |
| Beating | The Watchdog heartbeat fires. This is correct. |
| Not checked yet | Up to about 15 seconds after a restart |
| Evaluation failed | The metrics engine could not check the rule |
| Off | The rule is off globally and for each service |
Alert state is unknown. means that the console cannot reach the metrics engine. This is not an all-clear. The top bar then shows Alerts unknown. Otherwise it shows the number of triggered rules.
Planned operations
While an operation restarts PostgreSQL on purpose (for example an upgrade, a restore, a switchover or a restart), the console silences the alerts that the restart causes, for that service only. The silences end 5 minutes after the operation, also when it fails. The service Overview shows, for example, Expected alerts silenced: service upgrade running, until a time.
- Silenced:
ServiceDownfor Patroni and the database exporters,PatroniNoLeader,ReplicationLagHighandReplicaNotStreaming. - A major upgrade, its rollback and Set up backups again also silence
ArchiveCommandFailingandBackupNeedsAttention. - Never silenced: the disk rules,
ServiceDownfornode_exporterand HAProxy, and the Console rules.
A failover is not planned: its alerts notify. A failed operation has no alert: it shows on Operations.
To turn this off, use Silence expected alerts during planned operations at the bottom of the Status tab (admin only).
To use your own Prometheus and Alertmanager, see Federate into your own Prometheus.