Logs and support
Read the logs of a database service, turn on verbose deploy logs, run diagnostics, and make a support report to send to Tiger Data support.
Service logs
Use the Logs & Diagnostics tab of a service. Server logs need the operator role.
Select the log
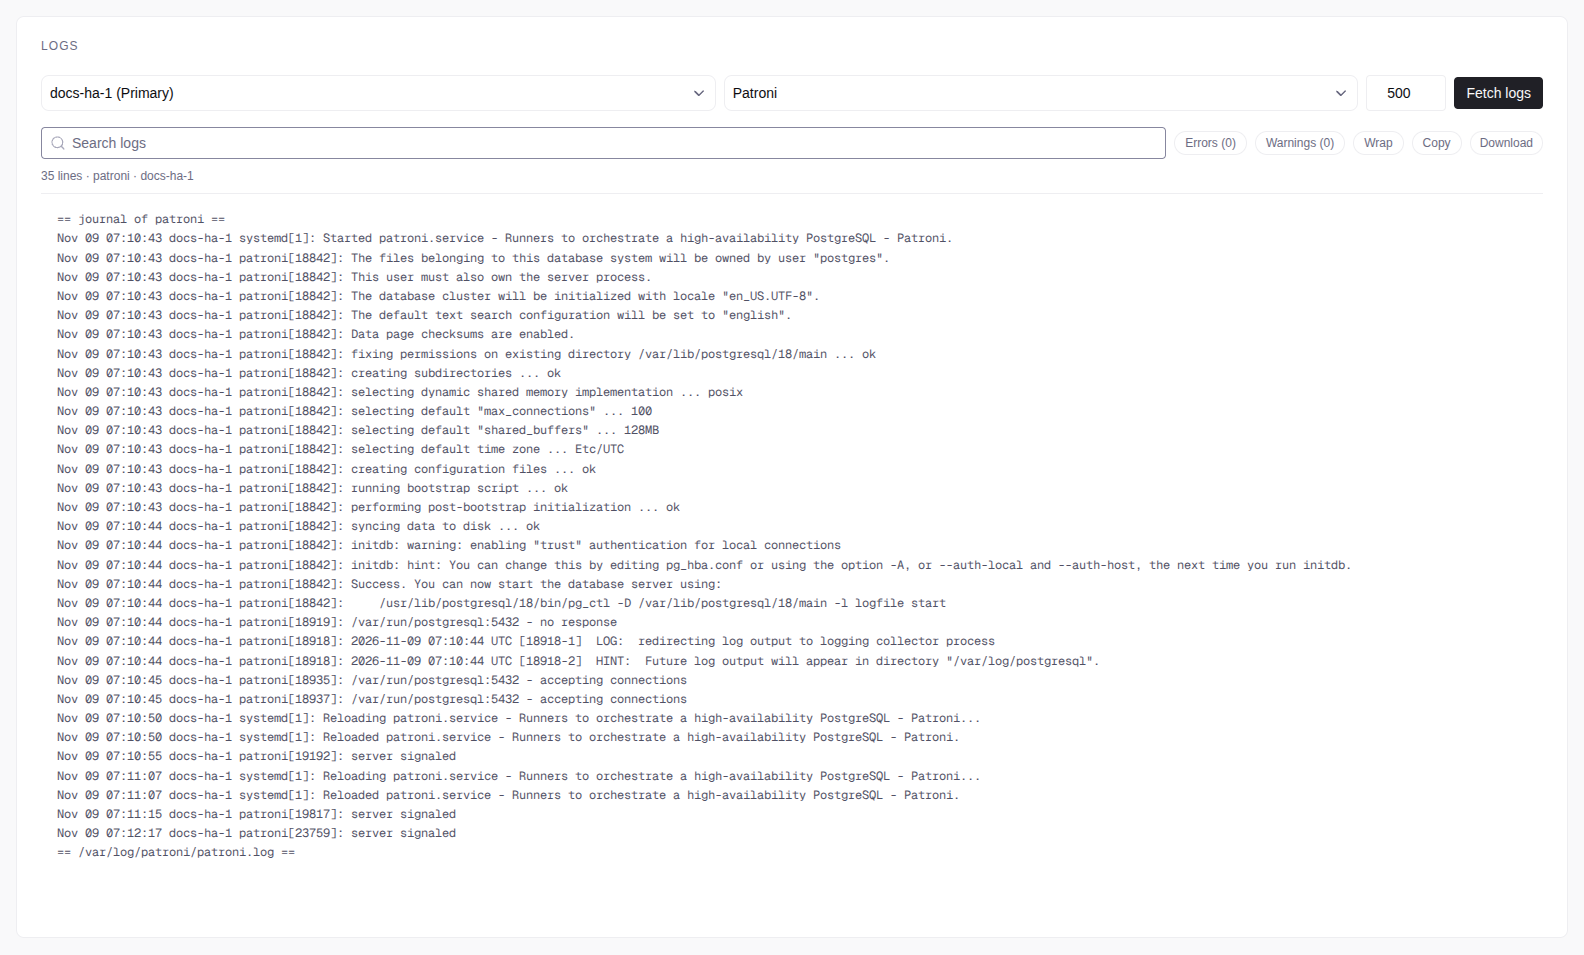
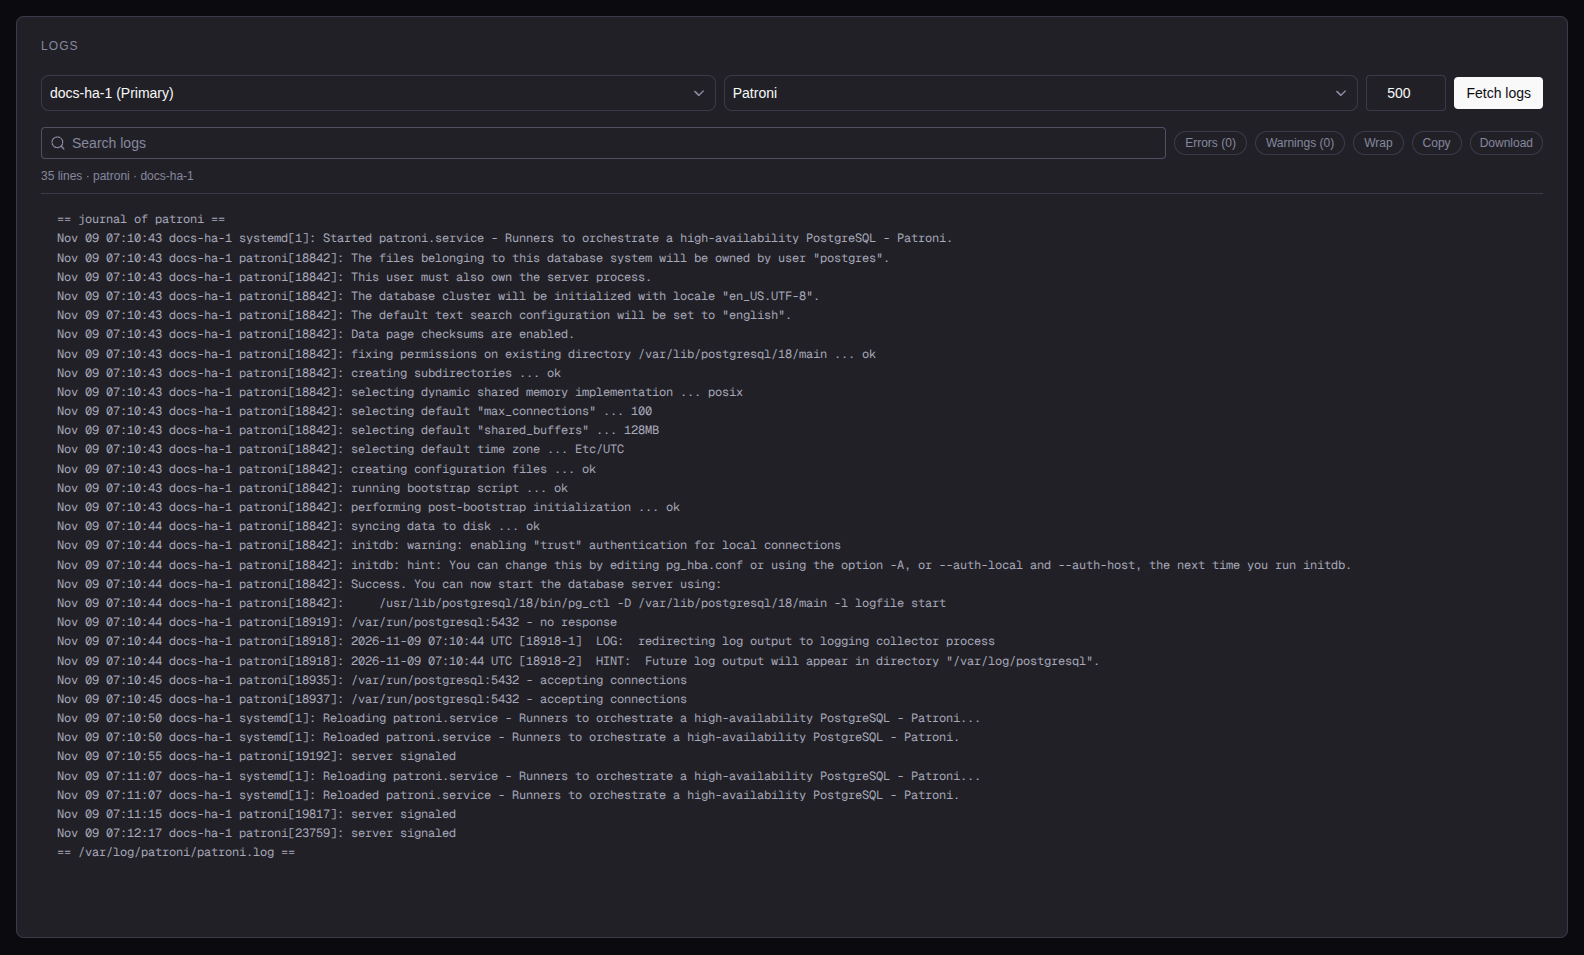
Select a server and a source: PostgreSQL, Patroni, System (the systemd journal) or PgBouncer. Patroni shows the Patroni messages of the journal first, then the Patroni log file. Set the number of lines: default 500, maximum 10,000.
Fetch the logs
Select Fetch logs. The viewer has search, error and warning filters, Wrap, Copy and download.
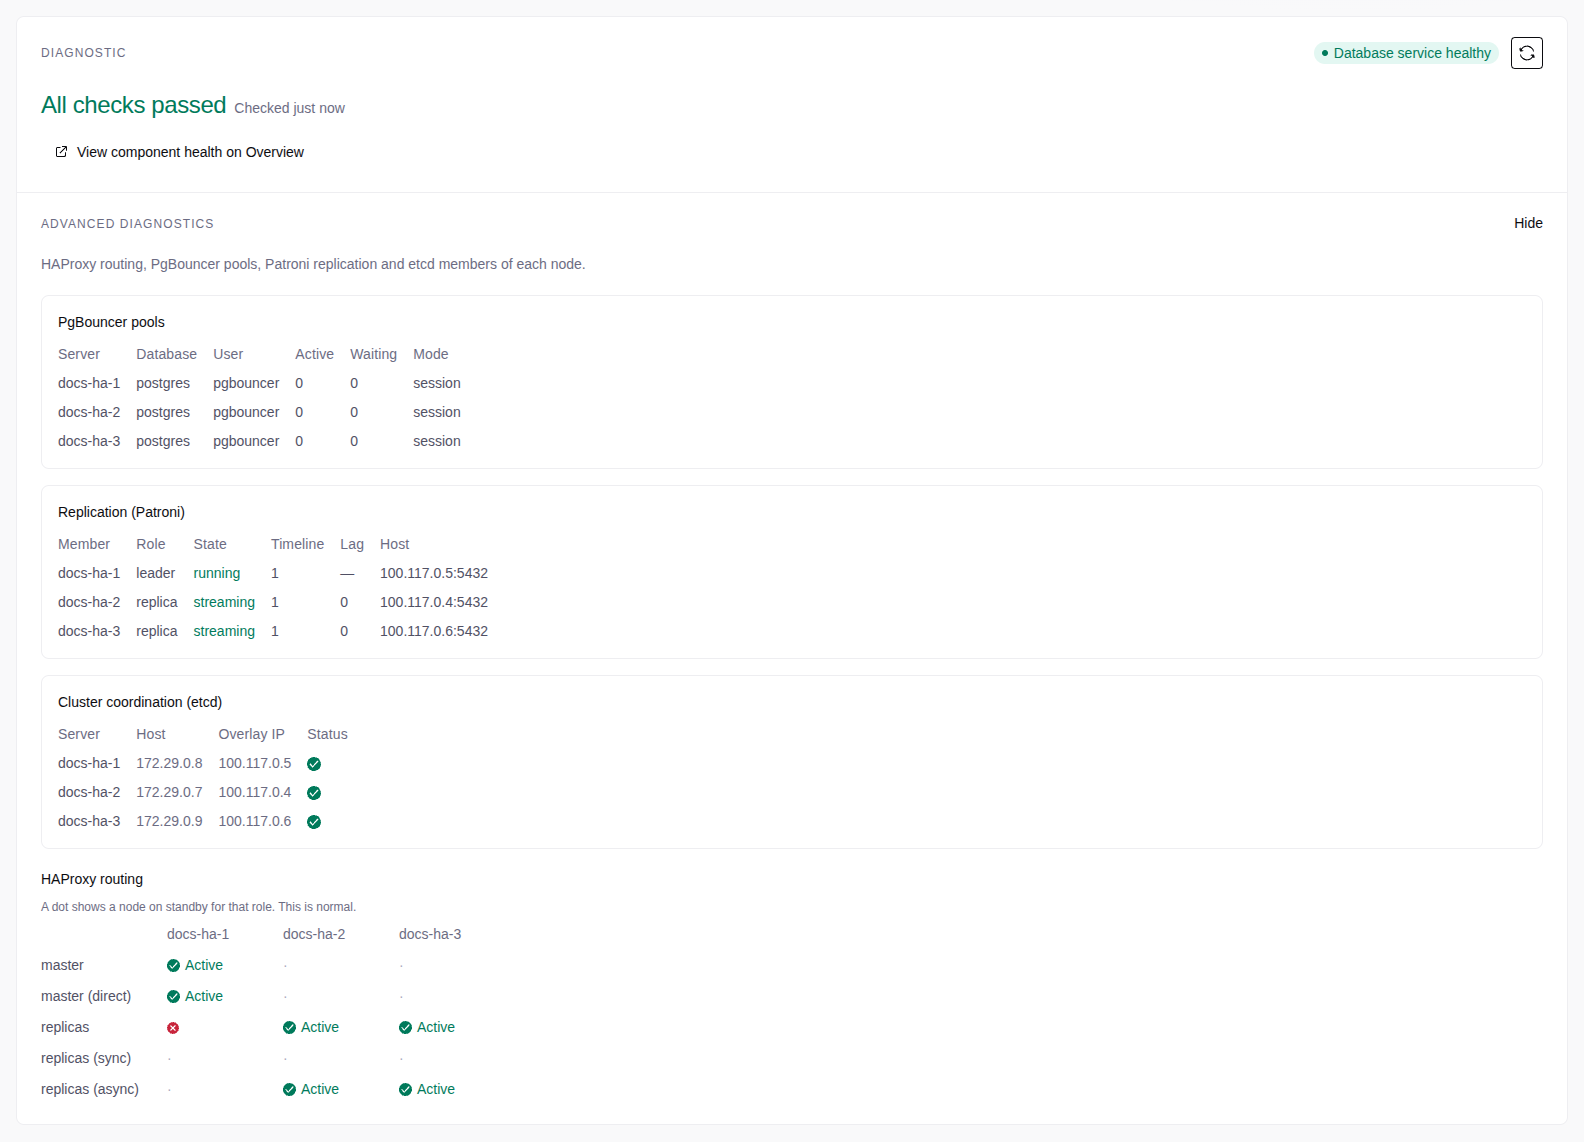
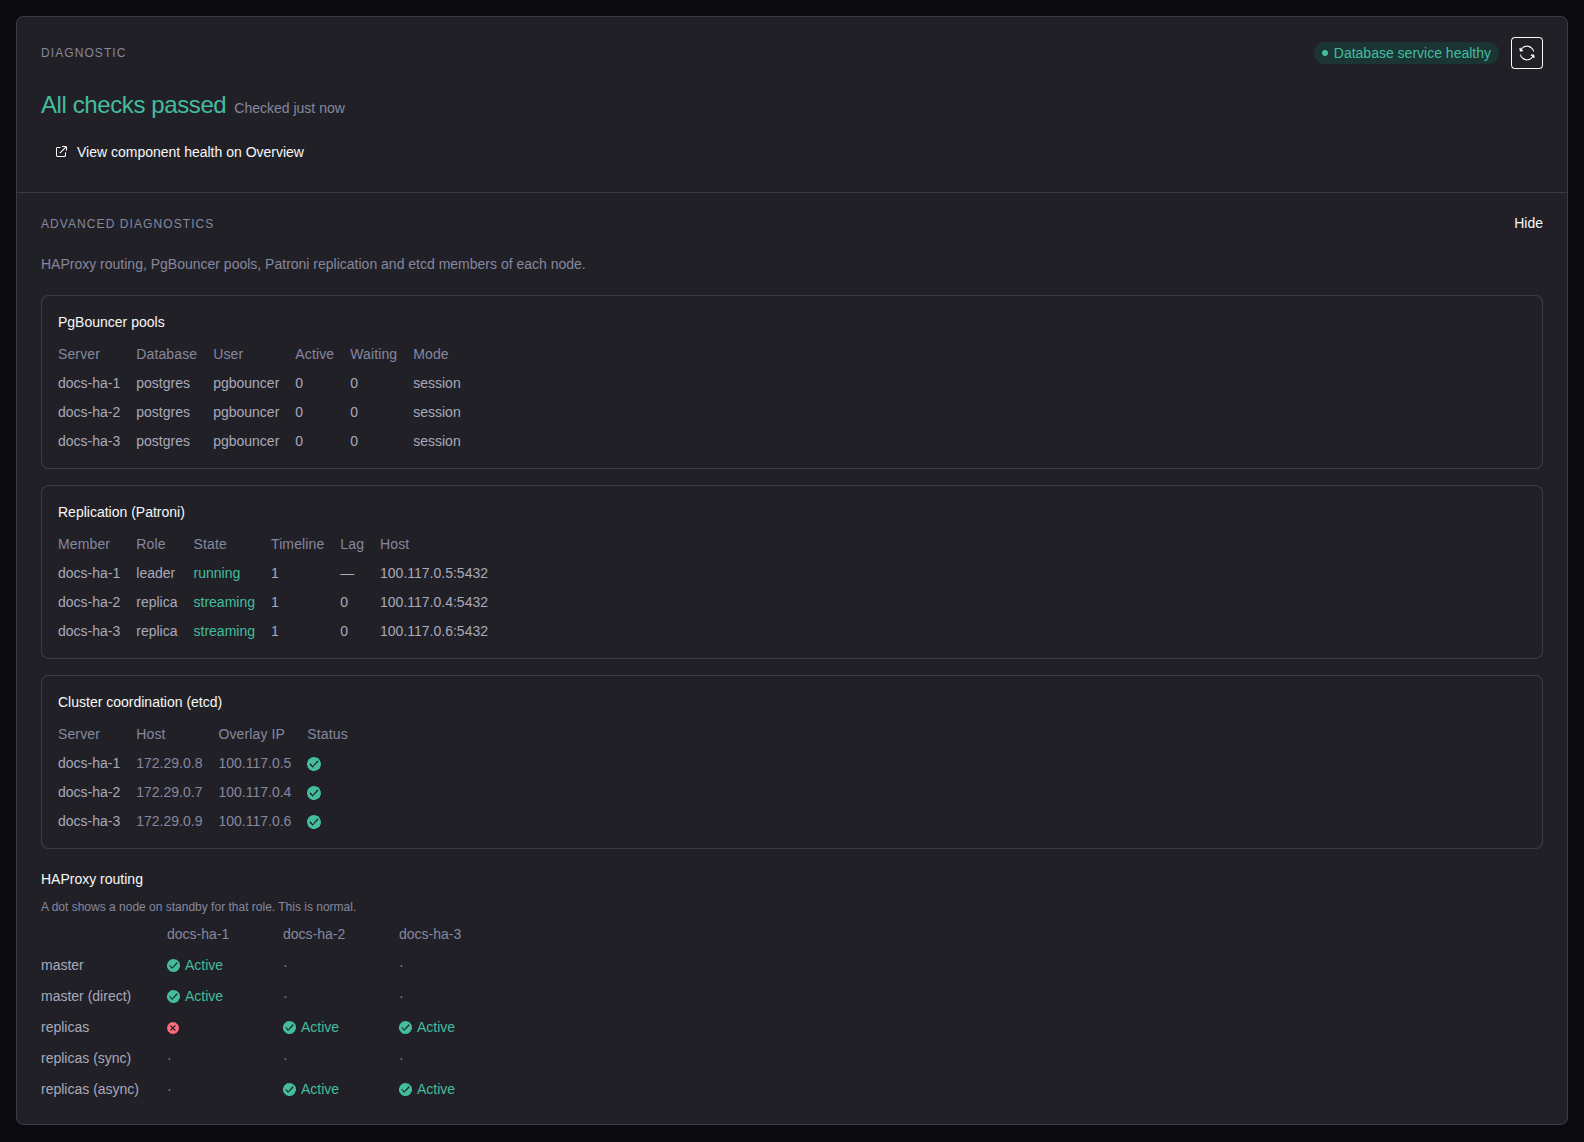
Advanced diagnostics shows for each node: HAProxy routing, PgBouncer pools, Replication (Patroni) and Cluster coordination (etcd).
To save the log of an operation, select the download button of the log panel, or Download logs in the menu of the operation row.
Log rotation
The console installs logrotate on each database server and backup server,
and runs it every hour:
- PostgreSQL writes one log file for each day of the week and empties it after a week. A file larger than 100 MB is compressed, and the server keeps three compressed copies of each file.
- pgBackRest logs rotate weekly, and the server keeps ten old files.
- PgBouncer logs rotate daily, and the server keeps seven.
Verbose deploy logs
When support asks for it, an admin turns on Verbose deploy logs on the Support bundle page. New operations then log each SSH command in the support report. Verbose logs are much larger. Turn the setting off when support has the logs.
Support reports
Open the Help menu (?) in the top bar, then Support bundle. Or select Generate support report on the Logs & Diagnostics tab of a service. An operator can make, download and delete reports.
Describe the issue
Select the Issue type. Enter a subject (required) and a description.
Select the data
Select the data for each service (the issue type sets the default), for each server, and Application logs. The report always has the console version, the services, the servers, the mesh status and the last health checks.
Generate the report
Select Generate report. The report downloads as a .tar.gz file, and
an email to support@tigerdata.com opens. Attach the file, then send
the email.
The Past bundles tab of the Support page lists the earlier reports.